
Most Australian beverage brands can tell you exactly how many cases they invoiced last month. Far fewer can tell you how many of those cases were actually sold to a drinker, at what price, in which venue, and on which day of the week.
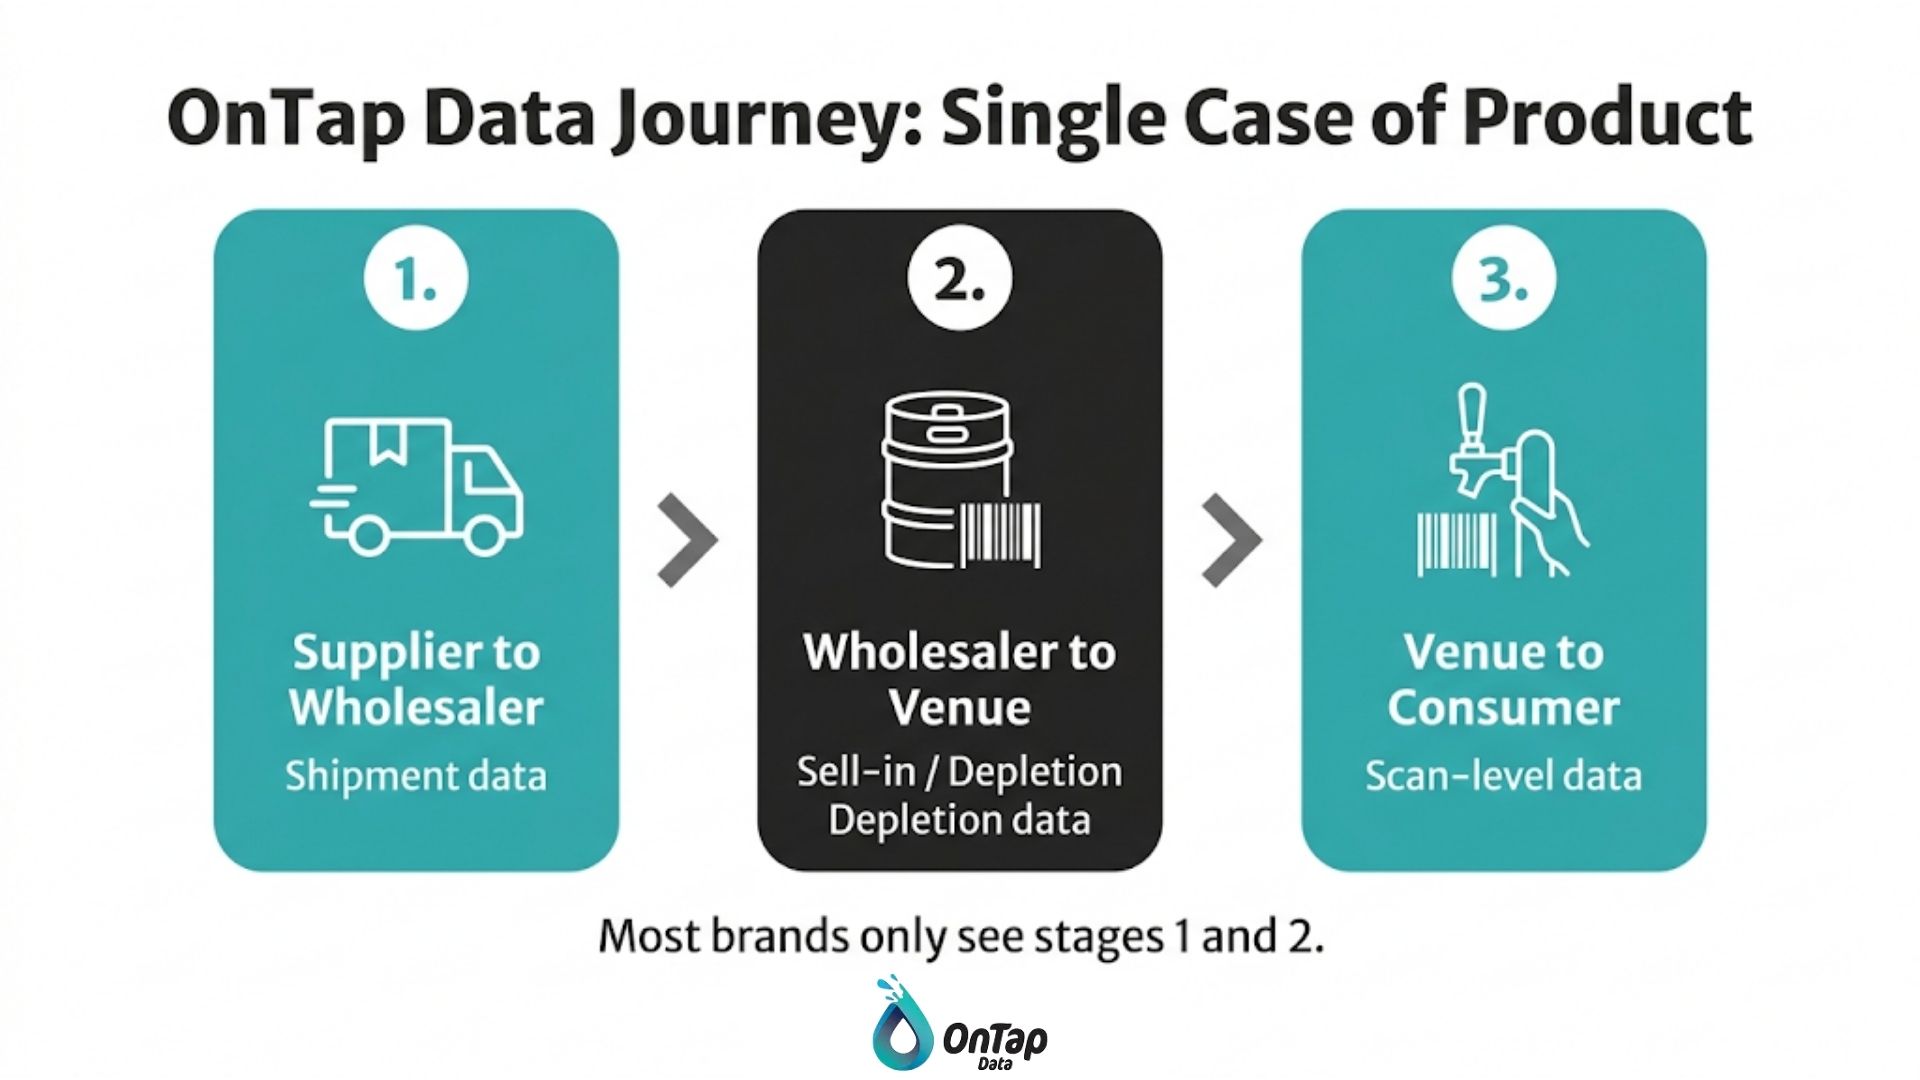
That gap is the difference between sell-in data and scan-level data. Invoice data tells you what left the warehouse. Scan-level data tells you what happened at the register.
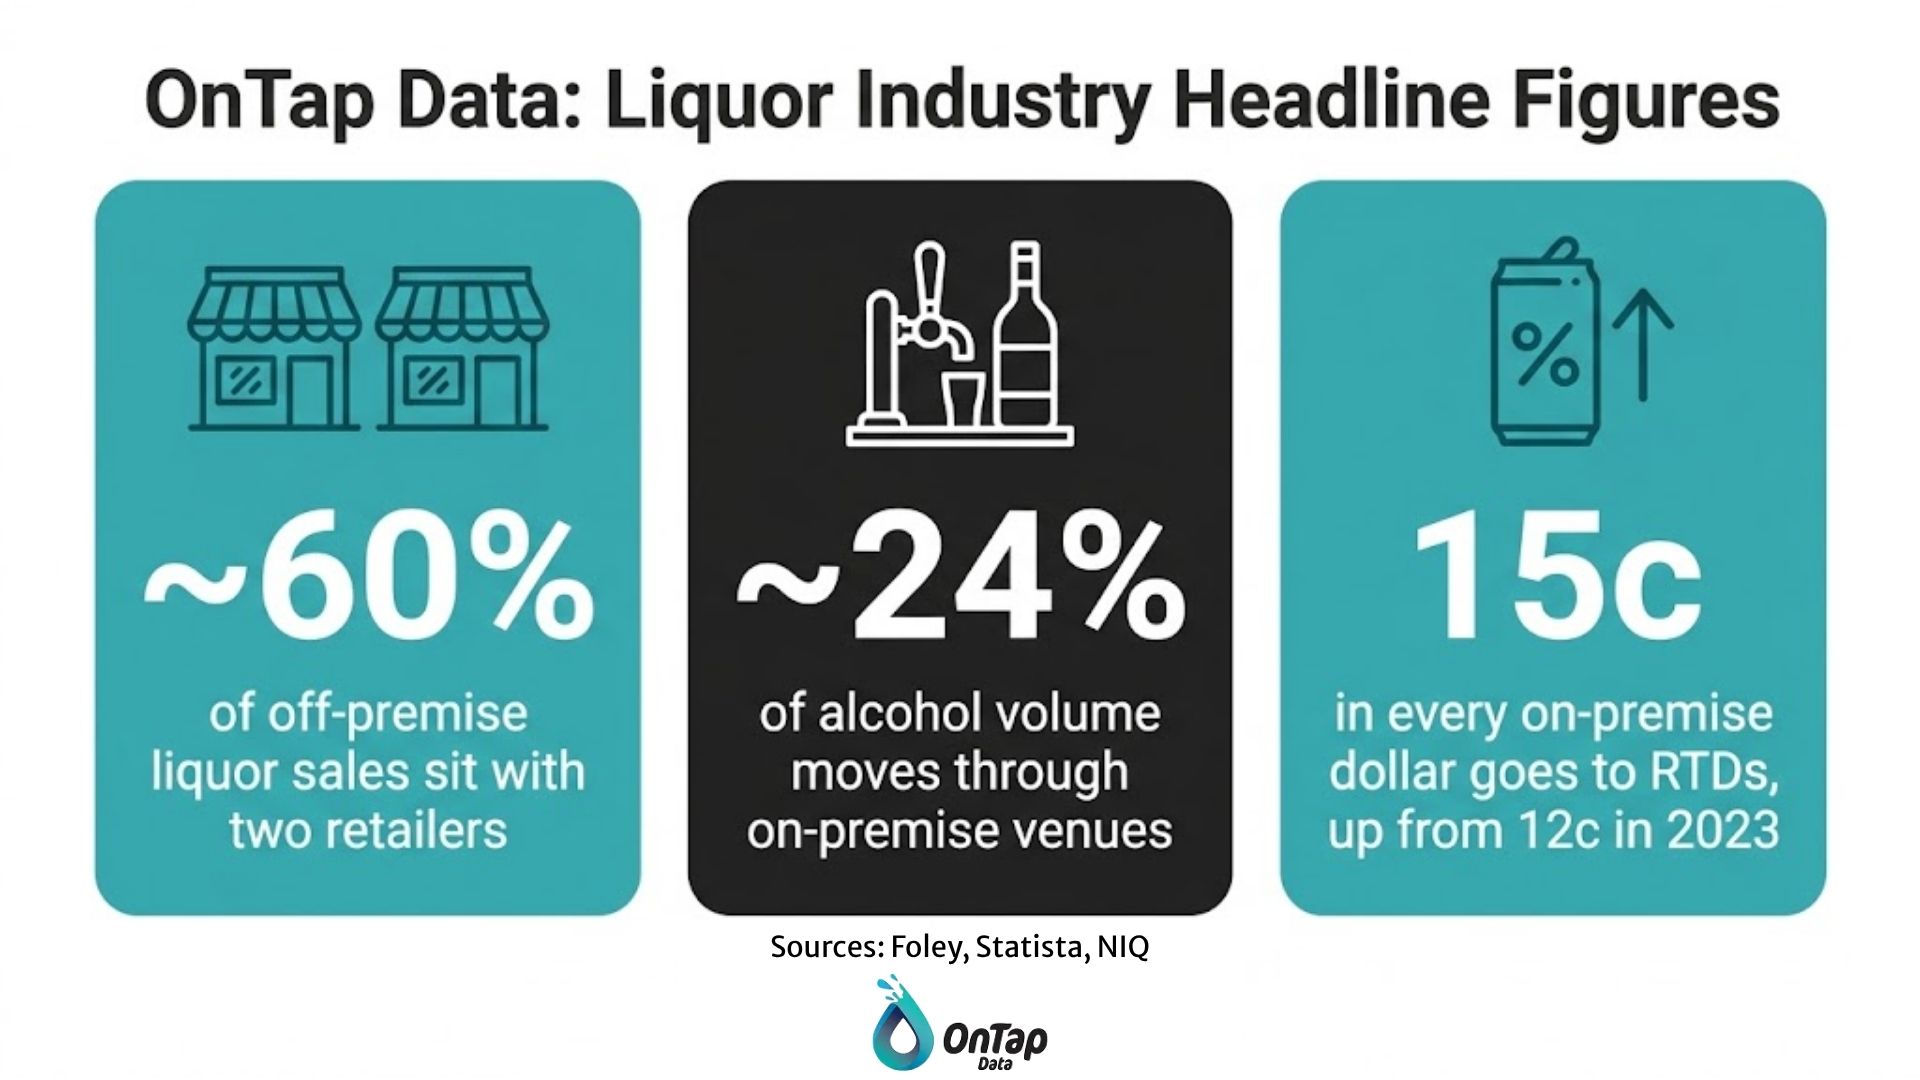
In a market where two retailers control roughly 60 per cent of off-premise liquor sales and the remaining volume is spread across thousands of independents, hotels, clubs and on-premise venues, that second number is where the commercial decisions live.
This guide covers what scan-level data is, what it can and cannot tell you, why it arrives messier than most brands expect, and how to turn it into decisions your sales team will actually act on.
What is scan-level data?
Scan-level data is transaction data captured at the point of sale, recording every individual product scanned or rung up at a venue’s register, including the price paid, the discount applied, the time of sale and the quantity.
Unlike wholesaler reports, which aggregate what a distributor invoiced to an outlet, scan data records the moment a consumer actually bought the product. It is the closest thing the beverage industry has to a direct read on real demand.
Scan data: Item-level transaction records generated by a venue’s POS system at the moment of purchase. Sometimes called sell-out, sell-through, or point-of-sale data.
The terminology gets muddled quickly, particularly because a lot of the material online is written for the United States three-tier system, which does not map cleanly onto how Australian liquor distribution works. Here is how the three data types compare in an Australian context.
| Data type | What it measures | Where it comes from | What it is good for |
|---|---|---|---|
| Sell-in (invoice) data | Product invoiced from supplier or wholesaler to an outlet | Wholesaler feeds such as ALM, Paramount Liquor and ILG, plus direct sales | Revenue recognition, remittance and claims, territory performance |
| Depletion data | Product moving out of a wholesaler’s warehouse to trade | Wholesaler reporting | Inventory health, spotting stock build-up before an order cliff |
| Scan-level data | Product sold to the end consumer at the register | Venue POS systems | Rate of sale, promotional lift, price realisation, range performance |
The important point: these three numbers rarely agree, and that is normal. A strong invoice month followed by flat scan performance means stock is sitting on shelf or in a cool room. Without scan data, you would not know until the reorder never came.
Why scan-level data matters more in the Australian market than most brands realise
Australia’s liquor retail market is unusually concentrated at the top and unusually fragmented underneath it, which means brand performance is decided in two very different environments at once.
Endeavour Group holds roughly 43.5 per cent of the retail market, Coles Group around 17.1 per cent, and Metcash around 10.4 per cent. The major chains supply their own detailed reporting to the suppliers they range.
Everything outside that, the independents, banner group members, hotels, clubs and on-premise venues, is where visibility drops away fastest, and it is also where challenger brands typically build their volume.
The on-premise channel is not a rounding error either. Out-of-home alcohol volume in Australia is forecast at roughly 499 million litres against 1,584 million litres consumed at home, so close to a quarter of total volume moves through venues where most suppliers have no direct read on sales.
Category dynamics make the case sharper. Ready-to-drink products now capture 15 cents in every Australian dollar spent in the on-premise, up from 12 cents in 2023, with roughly 198 million serves sold. Draught pre-mixed sales have risen 57 per cent in two years, more than triple the 17 per cent growth in packaged RTDs. A supplier working from invoice data alone sees cases going out the door. A supplier working from scan data sees whether the tap contract is actually pouring, and how fast.
Meanwhile, price is doing more of the work than volume. On-premise beer sales rose 1.2 per cent by value while falling 3.4 per cent by volume, with the average price of a 425ml beer up 8 per cent year-on-year and 13.4 per cent since 2022. On-premise spirits volumes fell 10.5 per cent across the same period. When growth is being driven by price rather than units, you need transaction-level detail to tell the difference between a healthy brand and an inflating one.
What scan-level data tells you that invoice data cannot
Scan-level data answers questions about consumer behaviour, while invoice data only answers questions about trade behaviour. Four of those questions carry most of the commercial value.
True rate of sale by venue
Invoice data tells you a venue ordered six cases. Scan data tells you whether those six cases sold in nine days or ninety. Rate of sale is the single most useful metric for prioritising a rep’s call cycle, because it separates accounts that need restocking from accounts that need re-selling.
Promotional lift against a real baseline
Proving promotional return requires knowing what sales looked like before, during and after the activity at the same venues. Scan data gives you a genuine pre-promotion baseline at outlet level, which means you can calculate incremental units rather than assuming that everything sold during the promotion period was caused by it.
Range gaps and phantom distribution
A product can be listed at a venue and still never sell, either because it never made it to the fridge, the tap or the shelf, or because it sat in the wrong position. Scan data exposes accounts with zero scans against an active listing, which is a very different sales conversation from a genuine range gap.
Price realisation at the register
Trade terms and promotional pricing are agreed centrally. What happens at the register is often something else. Scan data shows the actual retail or serve price achieved, which lets you see whether your investment reached the consumer or was absorbed somewhere along the way. This is also where scan data connects directly to trade spend management.
| Question | Invoice data | Scan-level data |
|---|---|---|
| Did the venue order? | Yes | No |
| Did the product sell? | No | Yes |
| How fast did it sell? | No | Yes |
| What price did the consumer pay? | No | Yes |
| Did the promotion generate incremental units? | Estimate only | Yes |
| Is a listed product actually on shelf or on tap? | No | Indicated by zero-scan accounts |
Where scan-level data comes from, and why it arrives messy
Scan-level data is extracted directly from the POS systems running in member venues, which in Australia typically means platforms such as Bepoz, Impos, H&L, SwiftPOS, Bluize and Shopfront.
That variety is the first problem. Every POS system exports a slightly different file structure, product description format and hierarchy. The second problem is worse, and it is the reason many brands abandon scan data projects before they see value.
The product mapping problem
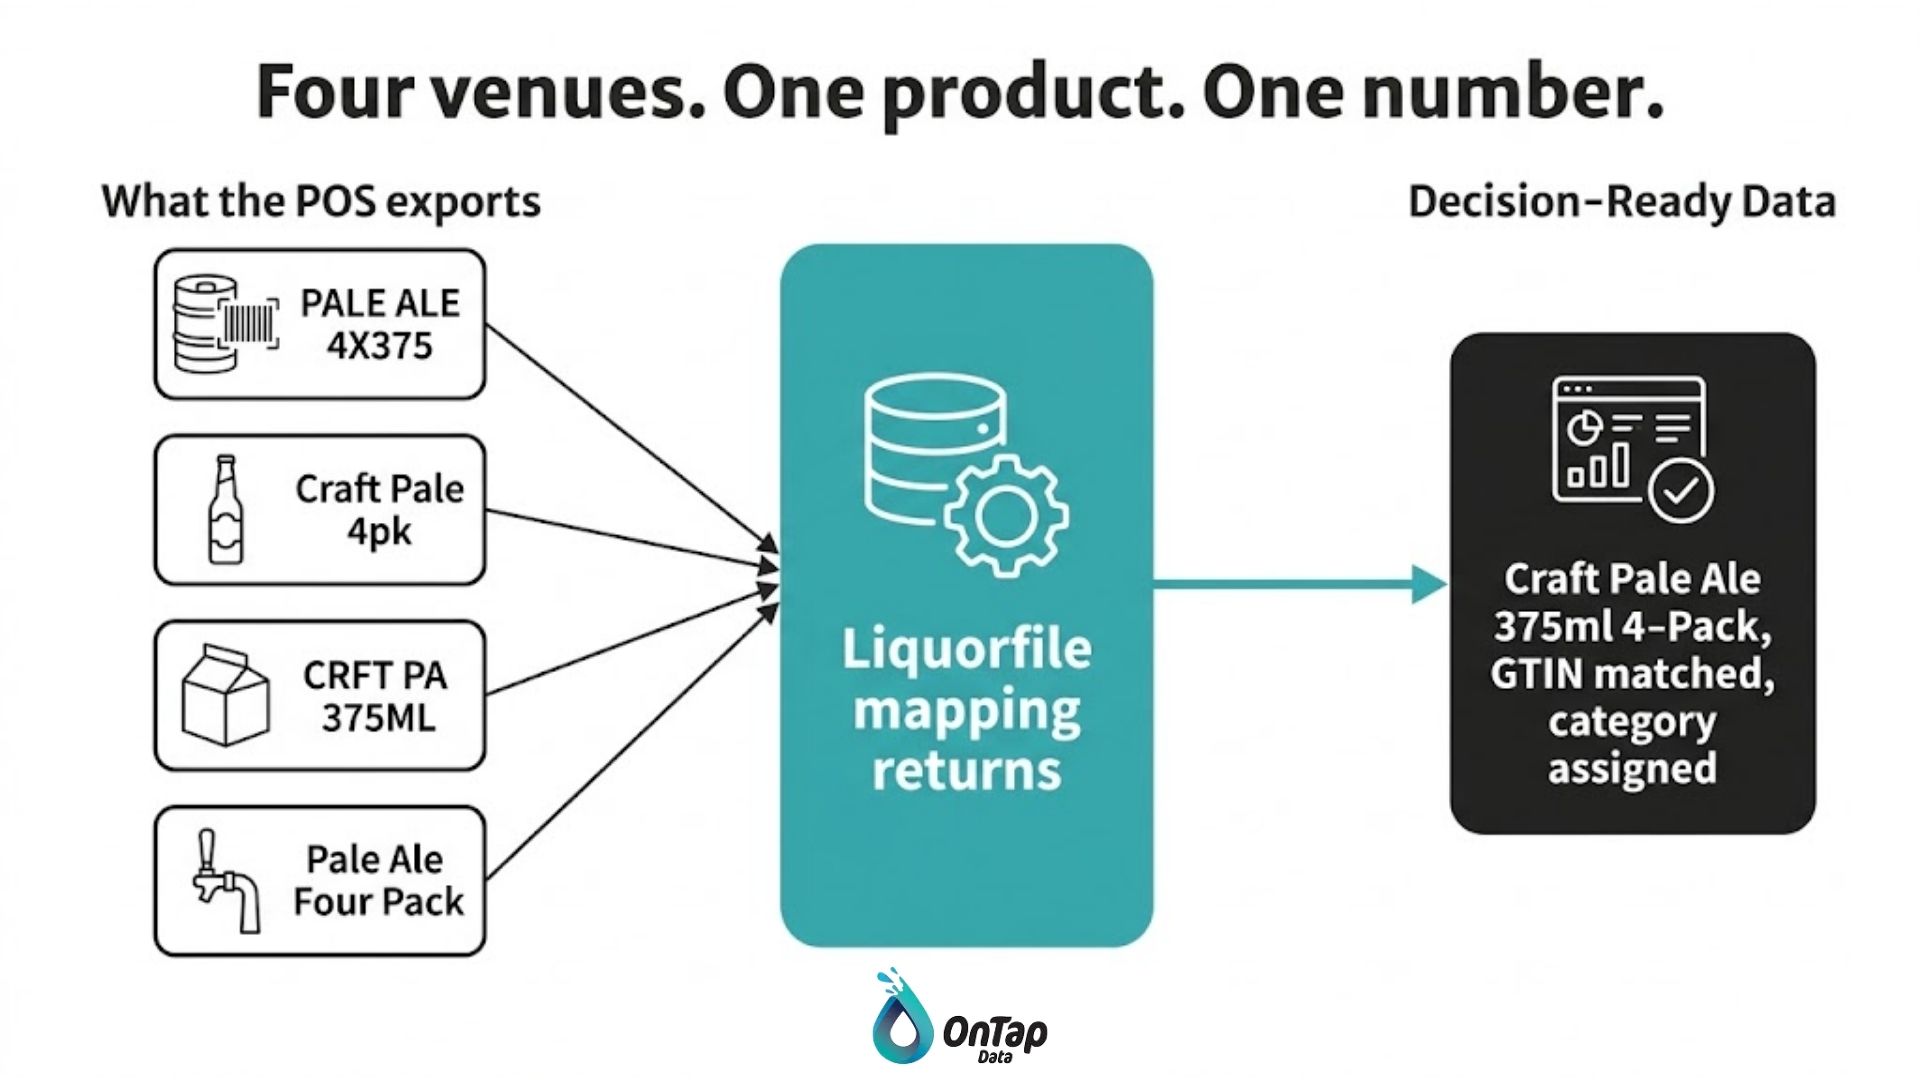
The same SKU is described differently in every venue. One pub has it as “Craft Pale 4pk”, another as “PALE ALE 4X375”, another as an abbreviation only the venue manager understands. Until every one of those descriptions is mapped to a single product identity, your scan report is not a report, it is a pile of strings. This is why a standardised product catalogue matters. Liquorfile exists as the Australian industry standard catalogue precisely so scan records from dozens of POS systems can be resolved back to one consistent product view.
The outlet mapping problem
Venue records are just as inconsistent. The same hotel appears under a trading name in one system, a licensee name in another, and a slightly different address in a third, which fragments its sales across three phantom accounts and makes territory reporting unreliable. A standardised outlet database such as Outletfile resolves those duplicates so that venue-level performance is genuinely venue-level.
Getting both mappings right is not optional. It is the entire precondition for scan data being usable, and it is the step most internal spreadsheet projects underestimate. OnTap’s own Liquology platform aggregates all sales and scan data under a single customer and product view for this reason, integrating directly with POS systems and the Liquorfile catalogue.
How to turn scan data into decisions your sales team will act on
Scan data creates value at the point where it changes a rep’s behaviour, not at the point where it produces a dashboard. The sequence below is the difference between a reporting project and a commercial one.
- Define the two or three questions you are actually trying to answer. Rate of sale by venue, promotional incrementality and range compliance are usually enough to start. Trying to answer everything produces reports nobody opens.
- Fix the mapping before you build the report. Product and outlet standardisation first, analysis second. Reversing this order is the most common reason scan data projects stall.
- Set a baseline period. You cannot measure lift without a clean pre-period at the same venues, so lock this in before your next promotional cycle rather than after it.
- Reconcile scan data against invoice data deliberately. Where the two diverge, you have found either a stock issue, a mapping issue or a genuine demand signal. Each requires a different response.
- Push the output into the systems reps already use. A venue-level scan insight that lives in a BI portal the field team never opens has no commercial value. Feeding it into the CRM they already work in does.
- Review coverage quarterly. Venue participation changes. A report built on a shrinking sample will quietly become less representative over time.
Suppliers running this alongside consolidated wholesaler data through SIMS get both halves of the picture in one place: what was invoiced, and what actually sold. Mountain Culture used that combination to support 44 per cent year-on-year growth while removing hours of weekly manual data work.
What scan-level data cannot tell you
Scan-level data is a sample, not a census, and treating it as complete truth leads to confident decisions built on partial evidence.
- It does not cover every venue. Your read is only as representative as the venues contributing data, and coverage is rarely even across states, channels or banner groups.
- It does not explain why. A drop in scans tells you what happened, not whether it was caused by a competitor promotion, a range change, a tap swap, weather, or a local event.
- It does not identify the consumer. Scan data records the transaction, not the person, unless a venue operates a loyalty program and separately consents to sharing that layer.
- It does not reconcile itself to invoices automatically. Timing differences between ordering and selling mean the two series will never line up week to week, and they are not supposed to.
- It does not fix bad hierarchy decisions. If your category and sub-category structure is wrong, granular data simply produces wrong answers faster.
Being clear-eyed about these limits is what separates a brand that uses scan data well from one that over-claims from it in a trade presentation and gets caught out.
How retail buying groups turn scan data into revenue
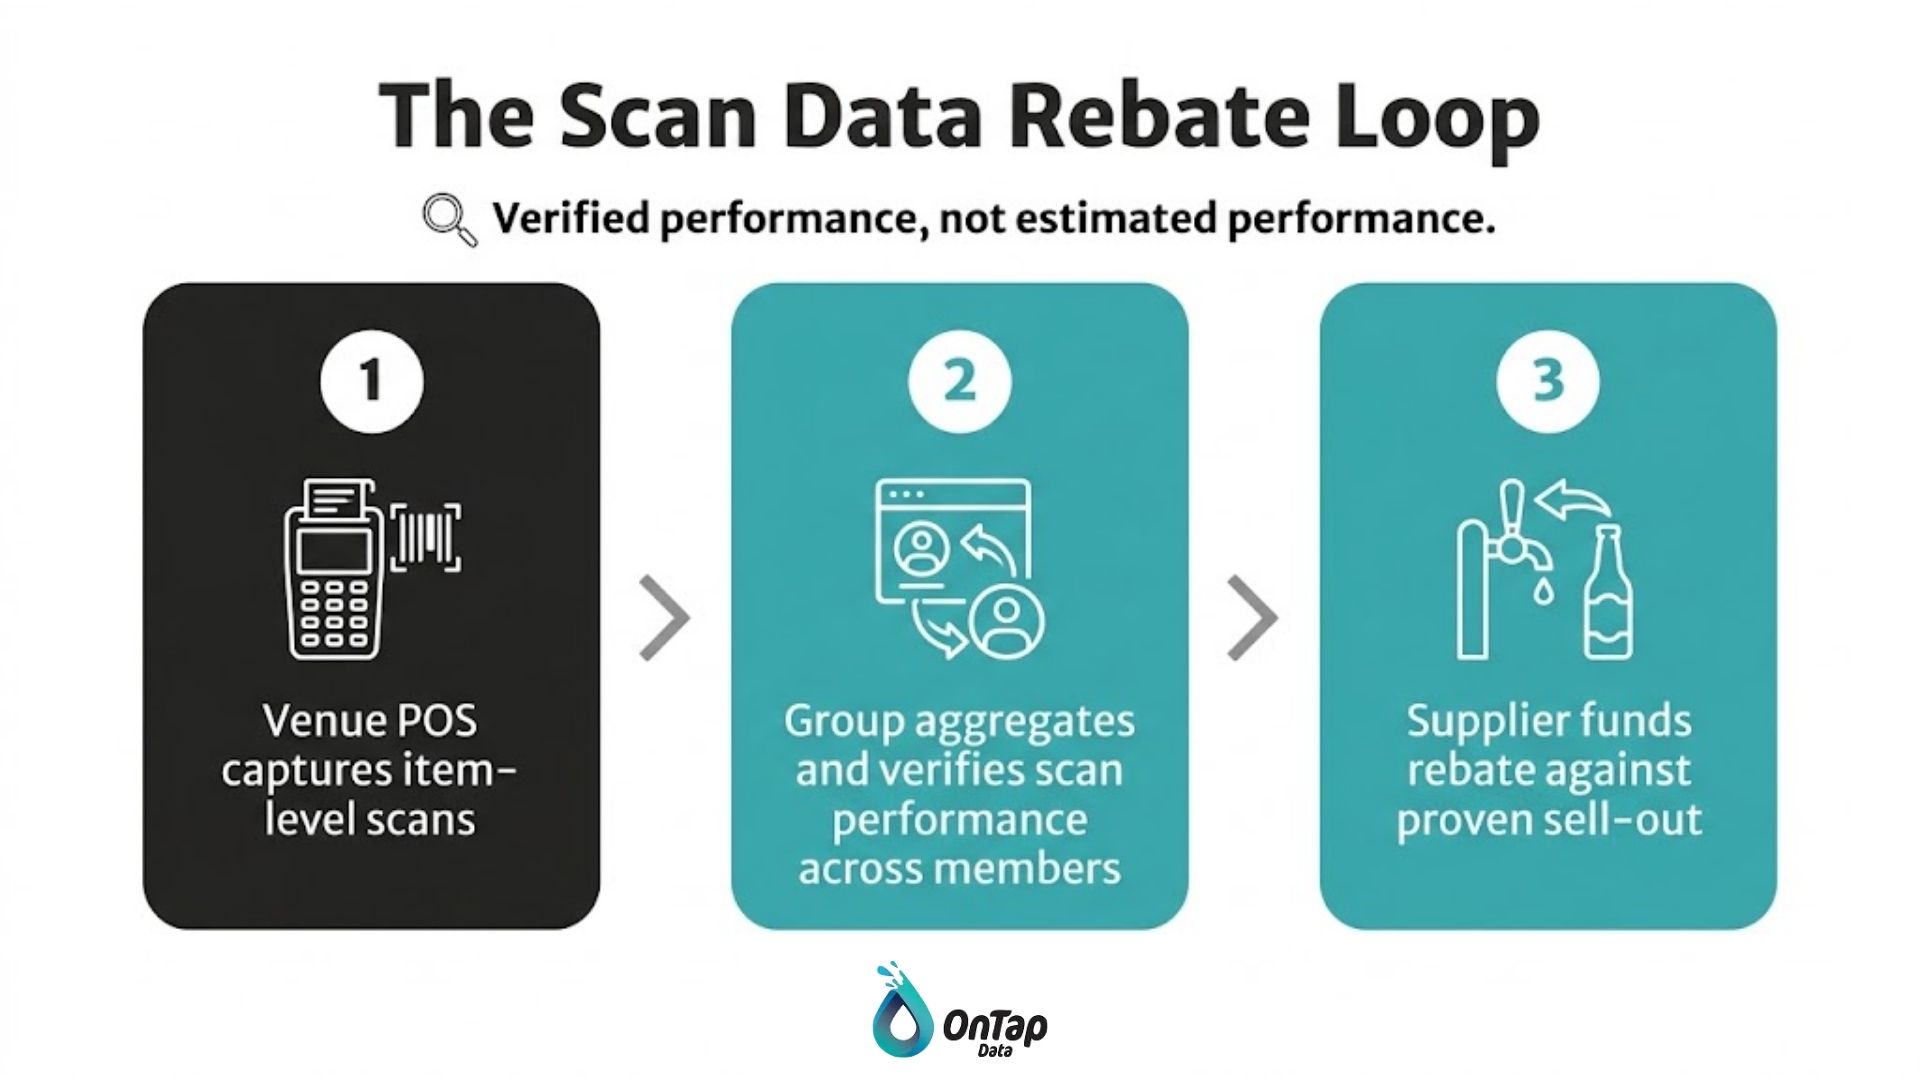
For retail buying groups, scan data is not only an analytical asset, it is a commercial one, because pairing member purchase data with member scan data supports rebate programs that would otherwise be unfundable.
The mechanism is straightforward. When a group can demonstrate verified, item-level sell-out performance across its member network, it can negotiate and administer supplier-funded rebate and promotional programs with confidence on both sides. Suppliers get proof of performance. Members get funding they can bank. The group gets a defensible position in negotiations.
Doing this at scale requires the ability to set up and manage rebate programs for individual members, pair purchase data with scan data, and analyse promotional performance across participating venues, which is exactly what Liquology is built to handle. Groups managing the promotional side of that equation across a member network typically pair it with Promoflo for planning and approvals, and GIMS for group-level reporting.
Who owns venue scan data, and how it should be handled
Scan data belongs to the venue that generated it, and it should only move to a group or supplier under a clear agreement covering what is shared, at what level of aggregation, and for what purpose.
This matters more now than it did five years ago, for two reasons. The first is regulatory: commercial transaction data handled on behalf of Australian businesses sits under Australian Privacy Act obligations, and the arrangements need to reflect that.
The second is technological. Feeding commercially sensitive sales data into public generative AI tools exposes it to systems your business does not control and cannot audit, which is a materially different risk profile from processing it in a purpose-built environment.
OnTap Data uses its own purpose-built AI systems rather than public AI tools, so client data is never used to train external models and is not shared with third parties without consent. If you want the longer version of that argument, it is covered in Before You Trust OpenAI with Your Data and Maintaining the Integrity of Your Data.
Is your brand ready for scan-level data?
A brand is ready for scan-level data when it has a clean product and outlet foundation, a specific commercial question to answer, and someone accountable for acting on the output.
| Readiness signal | You are ready | Fix this first |
|---|---|---|
| Product data | Every SKU maps to a standardised catalogue identity | Products are named inconsistently across systems and spreadsheets |
| Outlet data | Venues exist once, with consistent naming and territory allocation | Reps create outlet records ad hoc, producing duplicates |
| Commercial question | You know the two or three decisions the data will change | You want scan data because competitors have it |
| Ownership | A named person reviews the output and drives follow-up | The report will be emailed to a distribution list |
| Baseline discipline | Promotional periods are defined in advance | Lift is calculated after the fact from memory |
| Channel focus | You know which channel matters most to your growth plan | Coverage expectations are undefined |
If the right-hand column looks familiar on the outlet row, this piece on sales reps creating outlet records covers why that particular habit causes disproportionate damage downstream.
Frequently asked questions
Is scan data the same as POS data?
Effectively yes, though the terms carry different emphasis. POS data describes the raw transaction records a register produces. Scan data usually refers to those records once they have been extracted, standardised and made available for analysis by suppliers or groups.
How is scan data different from wholesaler sales reports?
Wholesaler reports show what was invoiced from a distributor to an outlet, which is sell-in. Scan data shows what the outlet sold to a consumer, which is sell-out. Both are necessary, and the gap between them is often where the useful insight sits.
Do I still need scan data if I already receive wholesaler reporting?
Yes, if your growth depends on rate of sale, promotional efficiency or on-premise performance. Wholesaler reporting can show strong invoicing while product sits unsold at venue level, and you will only discover the problem when reorders stop.
How much venue coverage do I need before scan data is reliable?
There is no universal threshold, because it depends on how concentrated your volume is. What matters more than raw venue count is whether the contributing venues are representative of the channels and regions you are trying to read, and whether coverage stays stable enough to compare periods.
Which POS systems can scan data be extracted from in Australia?
Common Australian platforms include Bepoz, Impos, H&L, SwiftPOS, Bluize and Shopfront. Liquology syncs with these and others, extracting POS data directly from member venues.
Can scan data prove promotional ROI?
It can prove promotional lift, which is the harder half. Comparing sales during and after a promotional period against a clean pre-promotion baseline at the same venues gives you incremental units. Combining that with the cost of the activity gives you return.
How often is scan data updated?
That depends on the venue’s POS setup and the extraction schedule agreed with the group or platform. The practical question is not how frequently data can arrive, but how frequently your team can act on it, since weekly data reviewed monthly delivers monthly value.
Stop collecting. Start commanding.
Scan-level data is not valuable because it is granular. It is valuable because it answers questions that invoice data cannot: whether your product is actually selling, where it is selling fastest, what price the consumer really paid, and whether your promotional investment did anything at all.
Three things separate the brands that get value from it from the ones that give up:
- Fix the foundation first. Standardised product and outlet data is the precondition, not an optimisation.
- Start with a question, not a dashboard. Two or three decisions you intend to change beats forty metrics nobody reads.
- Put it where the work happens. Insight that reaches the rep in the field is worth more than insight that sits in a portal.
OnTap Data has spent more than 25 years building the data infrastructure behind Australia’s liquor industry, and Liquology exists to give suppliers, wholesalers and retail buying groups a genuine view of what is happening at venue level.
Request a demo of Liquology or get in touch with the team to talk through what scan-level visibility would look like for your brand.


